Data-Science-Portfolio

Includes resume, one-pagers of work done, and examples of programming and data science projects
View the Project on GitHub RicardoFrankBarrera/Data-Science-Portfolio
@My Startup: Real Estate Investment Recommendation System
Shortly after I left Accolade, I began to improve upon some personal analytics tools I made for my real estate investment hobby. I was curious to see how much of my process I could automate and what the user-experience would be like as I automated more of it.
Data Challenges in Real Estate
For those unfamiliar with real estate investing, there are some interesting data problems providing fun challenges. For instance:
- data is incomplete
- much of the data on a home is not available, such as age of infrastructure like plumbing
- data is inconsistent
- a lot of data is manually entered by different entities so errors are common
- data is biased
- homes being listed for sale / rent are presented with bias
- data is stale
- housing records don’t update often
- data is subjective
- some data like neighborhood crime statistics has subjectivity
- data is expensive to collect
- getting a home inspector, for example, may cost $300 to $500
Training AI to Think Like I Do
So, I set out to see if I could infer as much information as possible from what was available online in an automated fashion. There are plenty of sites with records written records (e.g., county records indicating square footage), but the one really valuable untapped resource at the time was the property’s photos.
Analyzing imagery is really, really hard and there was no chance I’d be able to create my own image analyzer from scratch that was worth anything. However, a few events coincided that made this approachable:
- Tensorflow had recently come out and made deep learning more approachable,
- Google released Inception, an AI model to classify images
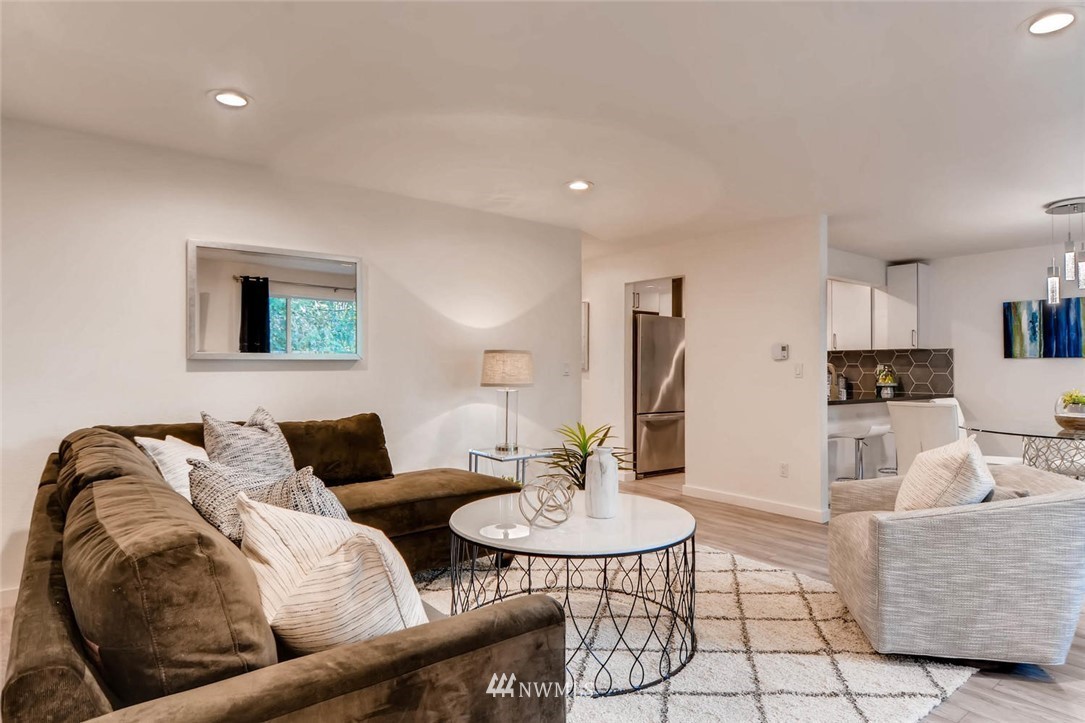
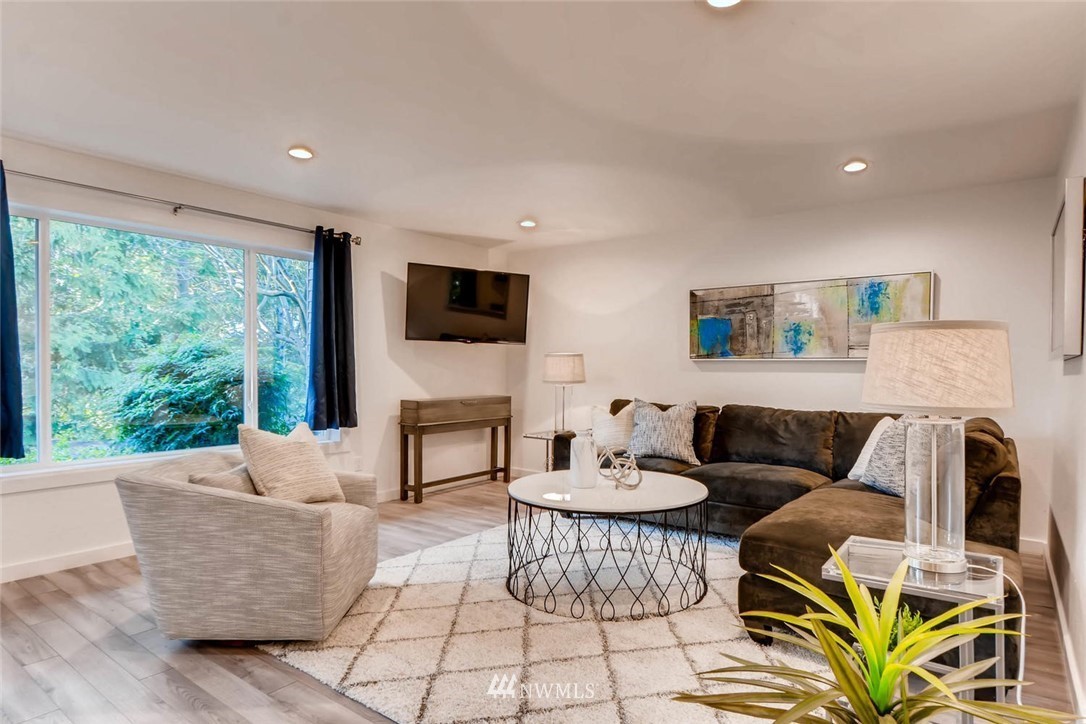
I believed I could shoehorn Google’s Inception model for my purposes (known as Transfer Learning) and retrain it on my own custom-labeled dataset. The retraining worked and I was able to get a reasonably effective (based upon my judgment) neural network to judge the quality of a home based upon photos.
The model has high variance and high bias, meaning that slightly different photos of the same space yield notably different results, and some unfamiliar design styles are very incorrectly scored (e.g., very nice log cabins can be mixed up with dilapidated homes…).
Scored 4.17 out of 5.0

Scored 3.03 out of 5.0

Nevertheless, this flawed model was still quite useful because it matched my personal judgment closely enough in the median case with enough photos; if I filtered outliers, I often got an overall quality score for a property that was within +/- 0.5 of what I would judge it. I had reasonably successfully trained this model to evaluate homes like I did (for the most part) and could scale out the search and evaluation process while I slept.
Defining and Creating the Vision
Emboldened by my success with the Neural Network, I decided to work on creating a Real Estate Investment Advisor platform where residential homebuyers could rely upon and learn from to become their own best advocate in an ecosystem notorious for taking advantage of the ignorant and unprepared. I’m passionate about fairness and education, and I’d seen many examples of friends suffering immensely because of poor real estate choices. Ideally, I’d be able to make a decent cashflowing business in the process.
Building the Minimum Viable Product (MVP) for the platform took quite a bit of work for many reasons:
- The data ecosystem in real estate is a mess,
- Building analytics and insights on top of poor quality data is not acceptable,
- I didn’t want to spend a lot of cash paying for data,
- The user-experience needed to be very simple so users had no excuse not to try it
This meant I needed to develop a fleet of webscrapers for each data source, merge the records together into a unified entity record, perform extensive data cleaning and imputation, and then build a clean, comprehensive, and sensible data ecosystem. The logic for merging entity records together was thankfully greatly simplified by using Google Maps API, among other resources.
Once I’d created the dataset for the Pacific Northwest, I proceeded with feature engineering to tease apart additional insights and signals from the data; for example, there is a lot of value in spotting differences in records across different platforms for the same entity.
I also began building analytics on top of the curated dataset to gather valuable statistics (e.g., rental distributions per sqft / bedroom / zip code), sale statistics (e.g., days on market heatmaps), and so on. It was better for me to think of all of the features and statistics which could possibly be useful and prune down after the fact because creative data and modeling insights come from having more information presented. Once I’d gotten all of the analytics and insights I wanted for the MVP, I proceeded with automating the Comparative Market Analysis (CMA) report.
Many residential homebuyers rely upon their realtor to generate a CMA report to justify their opinion on a home’s Fair Market Value. In an ideal world, this would be consistent and valuable, but the reality is most realtors carelessly select whatever is convenient to justify their end goal (e.g., get the buyer to spend more so they receive a larger commission). Good realtors, however, actually do spend quite a bit of time to do this. An automated CMA would ideally reduce bias, save time, and provide additional statistics and insights not available on other platforms.
Explainability and conciseness is important, so the initial CMA report was intentionally scoped on just the most important features (e.g., size in sq. ft, # of beds, # of baths, etc.), a list of comparables specifying which were used for the estimate and which were excluded, and a price estimate. The comparables selection algorithm used a blend of distance metrics (e.g., L-1 and L-2 norms) and the resulting valuation estimate was an ensemble model using my algorithm’s assessment along with other automated evaluations if available. See the visual below for a high-level view of the architecture.

The initial user experience was actually quite nice, as the user simply put in an address into my system and an automated report would generate and be emailed to them; if the data existed in the ecosystem, the report would show up in a few seconds, otherwise I had a separate code path to collect and analyze all necessary data on the fly to try and generate a report which sometimes took 15 to 30 minutes. See below for an example of one of the first automated reports I created.


Gathering Feedback and Iterating on the MVP
Once I had the MVP developed, I worked on getting answers to key questions, for example:
- Who were the customers?
- What are each customer’s needs, what scenarios are entirely missing, etc.?
- What revenue models would make sense for each customer / scenario?
- How should I go about getting early adopters?
In the process of testing out the user experience and getting feedback, I ended up partnering with a client/customer to purchase and renovate a few investment properties. So, additional progress on the MVP was postponed in favor of other work. At the time, some of my next set of features / high-level roadmap looked like:
- Identify and define key metrics to evaluate algorithm and business operation performance,
- Augment the MVP model to include labor and material cost estimates for repairs and renovations,
- Estimate renovation costs and after-repair value,
- Provide financial models to analyze different investment strategies (30 YR mortgage, versus cash, etc.),
- Create a chatbot (AI Advisor) to engage with clients for some basic scenarios (e.g., estimate their home value, provide leads to service providers, etc.)
- Improve upon the image analyzer to identify property features and architectural styles (e.g., modern, craftsman, etc.)
Normally it’s important to start with identifying and defining key metrics to evaluate algorithm and business operation performance first before building out, but I didn’t think it made sense to define performance and evaluation before I’ve confirmed technical feasibility with an MVP.
Closing Thoughts
As you can see, there is a lot to do in the real estate space as it’s complex and broad. I may dust off my old code and continue hacking away at this again in my spare time in the not too distant future. Just because Zillow failed with Zillow Offers, doesn’t mean it’s an impossible area to innovate in.